No. 316: CPI Inflation, Retail Sales, Trade and Liquidity
JOHN WILLIAMS’ SHADOW GOVERNMENT STATISTICS
COMMENTARY NUMBER 316
CPI Inflation, Retail Sales, Trade and Liquidity
August 15, 2010
__________
July Annual Consumer Inflation: 1.2% (CPI-U), 8.6% (SGS)
Retail Sales Hint at Third-Quarter GDP Contraction
Widening Trade Deficit Will Dampen GDP in Revision
Economic and Liquidity Crises Continue
__________
PLEASE NOTE: This Commentary supplants the Special Notice posted Friday (August 13th), where more-complete analysis had been delayed by some technical problems. The next regular Commentary is scheduled for Tuesday, August 17th, following release of July Industrial Production, Housing Starts and PPI.
– Best wishes to all, John Williams
With current projections for the federal budget deficit and related U.S. Treasury funding needs, as well the banking system’s solvency tests, all based on underlying assumptions of economic recovery and ongoing growth, the implications of continued economic downturn are horrendous in terms systemic risks and needed systemic liquidity.
Fed Gives Early Signal It Will Debase Currency to Prevent Systemic Collapse and/or Great Deflation. Those predicting deflation have reasons to do so, but I believe they are missing the nature of the U.S. government and central bank. To have a great deflation (in terms of consumer prices for goods and services), there needs to be some form of systemic collapse that helps to implode the money supply. (Issues in terms of inflation/deflation definitions and why collapsing debt does not trigger a quick onset of deflation all are discussed in the Hyperinflation Special Report.)
The Fed and the federal government did everything in their power in 2008 to spend or to create whatever money was needed to prevent systemic collapse, and they prevailed, at least for a brief period. Yet, the same risks face the system in the near future. Despite the relative stability seen in the financial markets and financial system, at present, little has been accomplished fundamentally to help the economy or to provide long-term stability to most of the banking sector. Such should become painfully obvious to the markets in the months ahead, as the economy renews its tumbling and the system reflects the impact of same.
The nature of the Fed and the federal government is to prevent systemic collapse. A collapse is unthinkable; it would mean a complete failure by the Fed and the federal government in their primary functions. Accordingly, irrespective of political or election-year niceties, the Fed and the federal government will spend or create whatever further money is needed to forestall systemic collapse. Faced with devil’s choices — a hyperinflation also leads to systemic collapse — the course of action selected likely will be the one that buys the most time (printing money and hyperinflation).
Due to ongoing structural banking problems, the broad domestic money supply has been in contraction, the economy is turning down again, and the Fed is scared. It signaled that this week when it agreed to start monetizing some Treasury debt. Ultimately, the U.S. dollar should face massive dumping as foreign investors flee dollar-denominated paper assets, and the Fed appears to be doomed ultimately to become lender of last resort for the U.S. Treasury. Such monetization and the flood of dumped foreign-held dollars into the U.S. will lead to higher inflation. As promised by Mr. Bernanke in 2002 (again, see detail in the Hyperinflation report), a central bank always can debase its currency, creating inflation. Critics of that concept offer that the process did not work in Japan, but the Japanese were not out to debase the yen.
As risks for a likely U.S. dollar panic and Treasury debt monetization near — high risk of same in the next six-to-twelve months — the general outlook for the economy and the markets is unchanged. For those with soft assets denominated in U.S. dollars, circumstances continue to suggest looking at actions for long-range wealth preservation. Despite any severe near-term volatility in the markets, physical gold and silver, assets outside the U.S. dollar (such as the Canadian dollar, the Australian dollar and Swiss franc) and assets outside the United States, offer long-term hedges against the severe loss looming in U.S. dollar’s purchasing power.
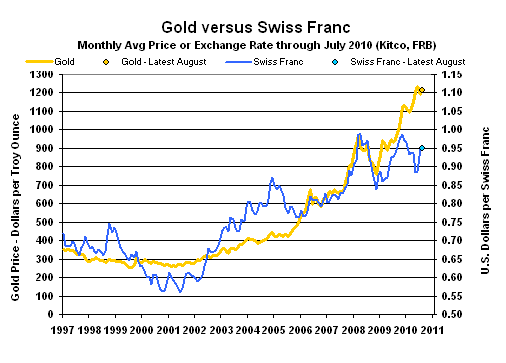
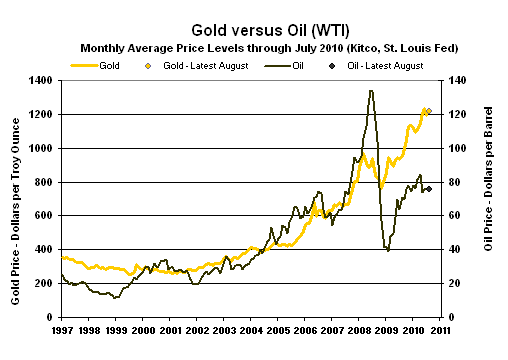
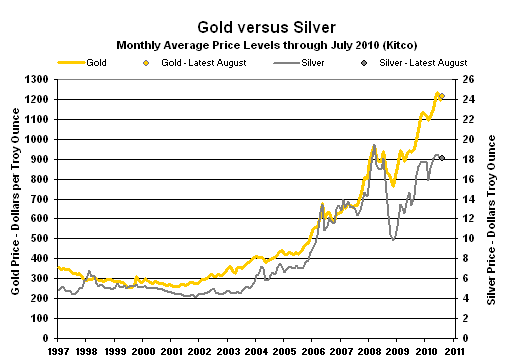
As suggested by the above graphs, the gold market continues to look beyond short-term volatility in the financial markets, with the upside distortions in the U.S. dollar’s exchange rate and the downside distortions to oil prices perhaps starting to reverse.
Notes on Different Measures of the Consumer Price Index.
The Consumer Price Index (CPI) is the broadest inflation measure published by U.S. Government, through the Bureau of Labor Statistics (BLS), Department of Labor:
The CPI-U (Consumer Price Index for All Urban Consumers) is the monthly headline inflation number (seasonally adjusted) and is the broadest in its coverage, representing the buying patterns of all urban consumers. Its standard measure is not seasonally adjusted, and it never is revised on that basis except for outright errors,
The CPI-W (CPI for Urban Wage Earners and Clerical Workers) covers the more-narrow universe of urban wage earners and clerical workers and is used in determining cost of living adjustments in government programs such as Social Security. Otherwise its background is the same as the CPI-U.
The C-CPI-U (Chain-Weighted CPI-U) is an experimental measure, where the weighting of components is fully substitution based. It generally shows lower annual inflation rate than the CPI-U and CPI-W. The latter two measures once had fixed weightings—so as to measure the cost of living of maintaining a constant standard of living—but now are quasi-substitution-based. Since it is fully substitution based, the series tends to reflect lower inflation than the other CPI measures. Accordingly, the C-CPI-U is the "new inflation" measure being proffered by Congress and the White House as a tool for reducing Social Security cost-of-living adjustments by stealth. Moving to accommodate the Congress, the BLS announced pending changes to the C-CPI-U estimation and reporting process on October 22, 2014, which are described in Commentary No. 668
The ShadowStats Alternative CPI-U measures are attempts at adjusting reported CPI-U inflation for the impact of methodological change of recent decades designed to move the concept of the CPI away from being a measure of the cost of living needed to maintain a constant standard of living.
CPI-U. The BLS reported Friday (August 13th) that the seasonally-adjusted June CPI-U rose by 0.31% (up by a statistically-insignificant 0.02%, unadjusted) +/- 0.12% (95% confidence interval, not seasonally adjusted) for the month, after a 0.14% decline (down 0.10% unadjusted) in June. Seasonally-adjusted, the CPI-U annualized rate of inflation for the three months ended July 2010 (July versus April) was virtually flat with a gain of 0.03%, against June’s decline of 1.46%. As the three-month spread crossed the changeover in monthly seasonal-adjustment impact on gasoline prices, unadjusted, the CPI-U annualized rate of inflation for the three months ended July 2010 also was flat, against June’s gain of 0.62%.
Unadjusted, July’s year-to-year inflation was 1.24% +/- 0.20% (95% confidence interval) against a 1.05% annual increase in June.
Year-to-year inflation would increase or decrease in next month’s August 2010 reporting, dependent on the seasonally-adjusted monthly change, versus the 0.37% adjusted monthly gain seen in August 2009. I use the adjusted change here, since that is how consensus expectations are expressed. To approximate the annual inflation rate for August 2010, the difference in August’s headline monthly change (or forecast of same) versus the year-ago monthly change should be added to or subtracted directly from July 2010’s reported annual inflation rate of 1.24%.
CPI-W. The narrower, seasonally-adjusted July CPI-W rose by 0.37% (up 0.03% unadjusted) for the month, following a decline of 0.19% (0.13% unadjusted) in June. Seasonally-adjusted, the annualized rate of CPI-W inflation for the three months ended July 2010 (July versus April) was a contraction of 0.37%, versus a decline of 2.39% in June. Unadjusted, the CPI-W annualized rate of inflation for the three months ended July 2010 was a decline of 0.11%, against a June gain of 0.59%.
Unadjusted year-to-year CPI-W inflation rose by 1.60% in July, versus a 1.36% June increase.
C-CPI-U. The Chain-Weighted CPI-U — the fully substitution-based series that gets touted by CPI opponents and inflation apologists as the replacement for the CPI-U — is reported only on an unadjusted basis. Unadjusted, the C-CPI-U annualized rate of inflation for the three months ended July 2010 (July versus April) was a 0.54% contraction, against June’s 0.27% gain. Year-to-year, or annual inflation, was 1.02% in July 2010, versus 0.82% in June.
Alternative Consumer Inflation Measures. Adjusted to pre-Clinton (1990) methodology, annual CPI inflation was roughly 4.5% (corrected from the 5.4% reported in the Special Notice) in July 2010, versus 4.3% in June, while the SGS-Alternate Consumer Inflation Measure, which reverses gimmicked changes to official CPI reporting methodologies back to 1980, was about 8.6% (8.57% for those using the extra digit) in July, versus 8.4% in June.
The SGS-Alternate Consumer Inflation Measure adjusts on an additive basis for the cumulative impact on the annual inflation rate of various methodological changes made by the BLS (the series is not recalculated). Over the decades, the BLS has altered the meaning of the CPI from being a measure of the cost of living needed to maintain a constant standard of living, to something that no longer reflects the constant-standard-of-living concept. Roughly five percentage points of the additive SGS adjustment reflect the BLS’s formal estimate of the annual impact of methodological changes; roughly two percentage points reflect changes by the BLS, where SGS has estimated the impact not otherwise published by the BLS.
Gold and Silver Highs Adjusted for CPI-U/SGS Inflation. Despite the June 28th historic high gold price of $1,261.00 per troy ounce, gold and silver prices have yet to approach their historic high levels, adjusted for inflation. TheLondon afternoon fix, per Kitco.com) of January 21, 1980 would be $2,382 per troy ounce, based on July 2010 CPI-U-adjusted dollars, and would be $7,727 per troy ounce in terms of SGS-Alternate-CPI-adjusted dollars (all series not seasonally adjusted). earlier all-time high of $850.00 (
In like manner, the all-time high price for silver in January 1980 of $49.45 per troy ounce (London afternoon fix, per silverinstitute.org) has not been hit since, including in terms of inflation-adjusted dollars. Based on July 2010 CPI-U inflation, the 1980 silver price peak would be $139 per troy ounce and would be $450 per troy ounce in terms of SGS-Alternate-CPI-adjusted dollars (again, all series not seasonally adjusted).
As shown on page 22 in the Hyperinflation report, over the decades, the price of gold has compensated for more than the loss of the purchasing power of the U.S. dollar as reflected by CPI-U inflation, while it has effectively fully compensated for the loss of purchasing power of the U.S. dollar based on the SGS-Alternate CPI.
Real Money Supply M3. The signal of the now unfolding intensification of the economic downturn, based on annual contraction in the real (inflation-adjusted) broad money supply (M3), most recently was discussed and graphed in Commentary No. 315. The annual real contraction in June M3 (SGS-Ongoing) estimated for that Commentary was 6.7%. Based on today’s CPI-U report and final estimate on the July SGS-Ongoing M3 Estimate, that annual contraction was 6.6%, narrower than June’s 6.9% contraction, and May’s post-World War II record annual decline of 7.9%. Updated below is the graph, which plots the year-to-year change in real M3 growth versus periods of official recession (as determined by the National Bureau of Economic Research).
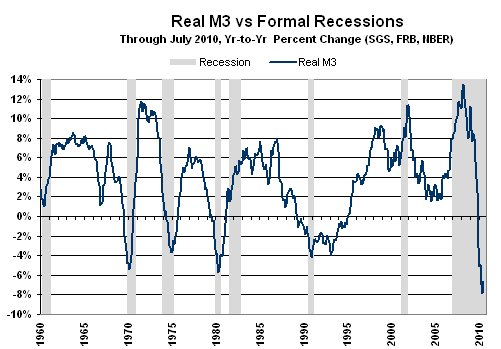
The signal for a downturn or an intensified downturn is generated when annual growth in real M3 first turns negative in a given cycle; the signal is not dependent on the depth of the downturn or its duration. The current downturn signal was generated in December 2009. The broad economy tends to follow in downturn or intensification roughly six to nine months after the signal.
Reported Nominal Retail Sales. Friday’s (August 13th) July 2010 retail sales report — issued by the Census Bureau — indicated a statistically-insignificant, seasonally-adjusted monthly gain of 0.41% (up 0.70% net of revisions) +/- 0.6% (95% confidence interval), versus a revised 0.28% (initially 0.51%) decline in June.
On a year-to-year basis, July 2010 retail sales were reported up by 5.52% from July 2009, versus a revised annual June gain of 5.18% (previously 4.80%). Annual changes still are working off the effects of the severe trough in activity seen somewhat over a year ago, while the Census Bureau plays games with the monthly seasonal factors and revisions to year-ago data.
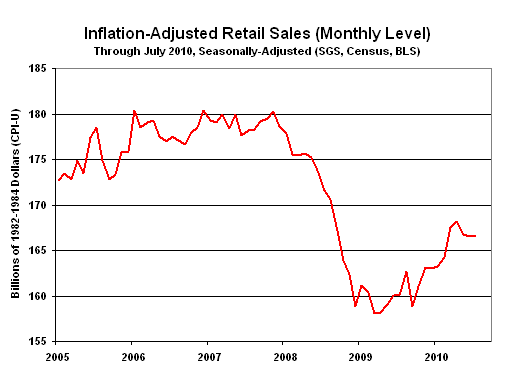
Real Retail Sales. Based on July 2010 CPI-U reporting, inflation- and seasonally-adjusted monthly July retail sales notched higher by 0.1%, where before inflation adjustment the current number was up by 0.4%, versus a revised 0.1% (was 0.4%) real monthly contraction in June. July real retail sales rose at a 4.2% year-to-year pace — up from June’s revised 4.0% (was 3.7%) annual pace — versus a 5.5% annual gain in July, before inflation adjustment.
On a quarter-to-quarter basis, real retail sales in second-quarter 2010 expanded at a 5.3% annualized pace, down from annualized growth of 6.6% in the first-quarter. Adjusted for inflation, seasonally-adjusted monthly retail sales in July are down at annualized pace of 1.1% versus the second-quarter, opening up the potential for a quarterly contraction in third-quarter retail sales.
Since November 2008, monthly real retail sales (CPI-U deflated) have been fluctuating around an average of $162.4 billion (the deflated July number was $166.7 billion). The first graph below reflects the relatively volatile monthly levels of real retail sales, as reported.
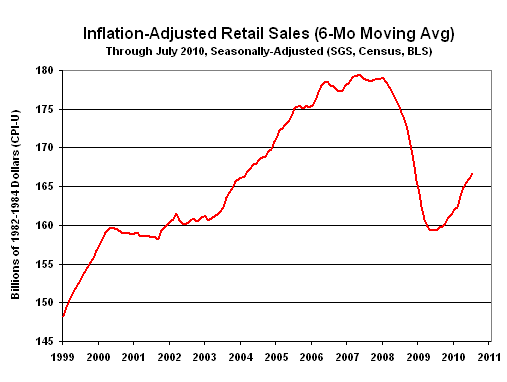
Smoothed for the monthly volatility on a six-month moving-average basis, as shown in the second graph, the pattern of activity here has been one of bottom-bouncing in terms of the level of inflation-adjusted sales. The recent bounce from short-lived stimulus factors and warped-seasonals appears largely to have run its course, with the average close to rolling over, and with continued lower real sales levels likely in the months ahead. There has been no change in underlying fundamentals that would support a sustainable turnaround in personal consumption or in general economic activity — no recovery — just general bottom-bouncing.
Core Retail Sales. Assuming that the bulk of non-seasonal variability in food and gasoline sales is in pricing, instead of demand, "core" retail sales — consistent with the Federal Reserve’s predilection for ignoring food and energy prices when "core" inflation is lower than full inflation — are estimated using two approaches:
Version I: July versus June seasonally-adjusted retail sales — net of total grocery store and gasoline station revenues — gained by 0.2%, versus the official aggregate gain of 0.4%.
Version II: July versus June seasonally-adjusted retail sales — net of the monthly change in revenues for grocery stores and gasoline stations — also increased by 0.2% versus the official aggregate gain of 0.4%.
Please Note: Our Chart Library section on Retail Sales also shows charts of the various sub-sectors making up the overall Retail Sales figure.
Nominal (Not Adjusted for Inflation) Trade Deficit. For June 2010, the BEA and the Census Bureau reported (August 11th) that the nominal seasonally-adjusted monthly trade deficit in goods and services rose to a much worse than expected $49.9 billion — the largest monthly trade shortfall since October 2008 — up from a revised $41.9 (previously $42.3) billion in May, and up sharply from the $27.1 billion monthly deficit in June 2009.
Against May 2010, the June trade balance showed a drop in exports and surge in imports, with the higher imports largely independent of seasonally-adjusted oil activity. Unadjusted oil imports reflected higher physical volume but lower oil prices. Specifically, for the month of June 2010, the not-seasonally-adjusted average price of imported oil was $72.44 per barrel, versus $76.93 in May 2010 and $59.18 in June 2009. In terms of not-seasonally-adjusted physical oil imports, June 2010 volume averaged 10.398 million barrels per day, versus 9.033 million in May 2010 and 9.402 million in June 2009.
Real (Inflation-Adjusted) Trade Deficit. A widening trade deficit directly reduces the reported level of and growth in GDP. The June trade number set-up a negative revision to the goods element of the net export component, in the upcoming the first revision to the second-quarter GDP (due August 27th).
As reported by the BEA, adjusted for seasonal factors and inflation (2005 chain-weighted dollars as used in reporting real GDP), the first-quarter 2010 annualized merchandise trade deficit was a revised $509.8 (previously $507.3) billion. As indicated in the previous trade report, the second-quarter deficit was running at an annualized pace of $541.3 billion, but that stands now at $577.1 billion. Due to underlying assumptions used by the BEA in its GDP estimate, something shy of the full differential is likely to flow through to the revision. Important here is that this particular series is just the merchandise sector, which eventually has a paper trail behind it, from reporting by U.S. Customs. It does not include the services area, which largely is a guesstimate by the BEA, and which traditionally runs a smaller offsetting surplus to the merchandise deficit.
Six-Month U.S. Trade Deficit Widened 35% versus Year Ago. Not seasonally adjusted, the U.S. trade deficit in goods and services widened by 35.0% to $293.756 billion in first-half 2010 versus $217.545 billion in first-half 2009. Much of the shortfall in trade was accounted for by the deficits with China, OPEC, NAFTA, the Euro Area and Japan.
The U.S. deficit with China, for the six months in 2010, widened by 15.9% to $119.452, from $103.075 billion the year before. Offsetting those numbers by the reported U.S. trade Surplus with Hong Kong left the net six-month 2010 deficit at $109.061 billion versus $95.104 billion, an increase of 14.7%.
The first-half 2010 U.S. deficit with OPEC rose 121.7% to $48.754 billion, from $21.994 billion the year before. The surge reflected an average 61.5% higher imported oil price in the 2010 versus 2009 period.
The U.S. deficit with NAFTA rose to $47.537 billion (Canada at $16.416 billion, Mexico at $31.121 billion) in first-half 2010, up 59.1% from $29.880 billion (Canada at $8.645 billion, Mexico at $21.235 billion). Some of the variability here was due to solvency problems in the U.S. auto industry.
The first-half 2010 U.S. deficit with the Euro Area rose 46.6% to $30.165 billion, from $20.580 billion the year before.
The first-half 2010 U.S. deficit with Japan rose 48.1% to $26.635 billion, from $17.986 billion the year before.
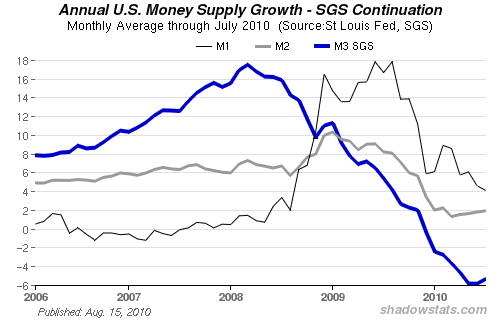
The data are based on seasonally-adjusted estimates of the Federal Reserve for key components, but even when the Fed reported the full M3, the seasonals often were suspect. Accordingly I view minor month-to-month changes in the estimated monthly M3 level to be flat. The patterns of year-to-year change in the latest M1, M2 and M3 numbers are shown in the accompanying graph. Reflected in the slight narrowing of the annual M3 contraction is the flattening of the monthly M3 numbers, not an improvement, but also not further monthly deterioration, at the moment.
A subscriber properly noted that the Total Commercial Paper Outstanding number includes financial institutions (and asset-backed securities), as well as non-financial institutions, so I have also added a plot on the non-financial sector, where the monthly volatility has been greater and changes more positive, recently, than in the total sector. The non-financial sector monthly improvements, though, are more in line with bottom-bouncing than a significant upturn, and annual change remains negative, though it is becoming less so. Commercial and industrial loans dominate the non-financial sector commercial paper in terms of volume, and when the two series are combined in an aggregate business loan series, the pattern of ongoing credit contraction is intact.
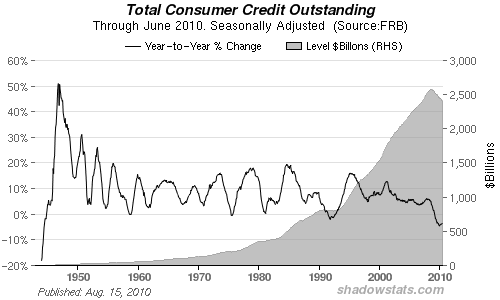
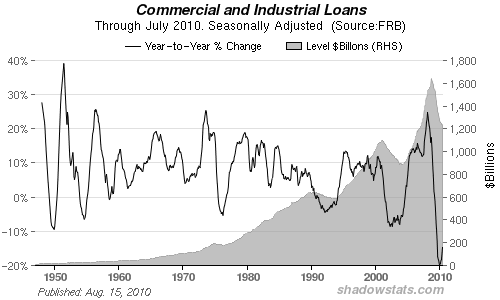
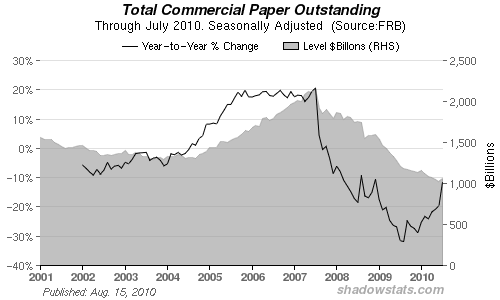
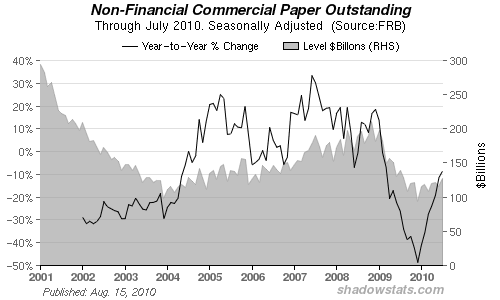
Please Note: The charts above are taken from the new "Credit" section.of our Chart Library.
Industrial Production (July 2010). Due for release on Tuesday, August 17th, July production is expected by the consensus to increase by 0.6%, per Briefing.com. Shy of an unseasonable surge in utility usage from unusual weather patterns, which also would spike certain manufacturing production components estimated from utility usage, and dependent on how the Fed seasonally adjusts unusual auto production patterns versus last year, look for weaker-than-expected monthly production. Properly adjusted, monthly production should be flat to minus.
Residential Construction — Housing Starts (July 2010). Housing starts data, due for release on Tuesday, August 17th, are likely to show their usual random volatility, with a monthly change that is not statistically meaningful.
Producer Price Index — PPI (July 2010). Due for release on Tuesday, August 17th, the PPI is due for a boost from a reversal in seasonal factors that recently have depressed oil-related inflation. Accordingly, an upside surprise to expectations is a fair bet for this somewhat randomly volatile series.
__________